Item Analysis
Identify questions that are too easy, too difficult, confusing or poorly discriminating, and determine whether each item is performing as intended.

Psychometric Assessment & Analysis
We provide Psychometric Assessment, Analysis & Reporting to help organisations understand not only how candidates perform, but how effectively the assessment itself performs.
Item II.E.069
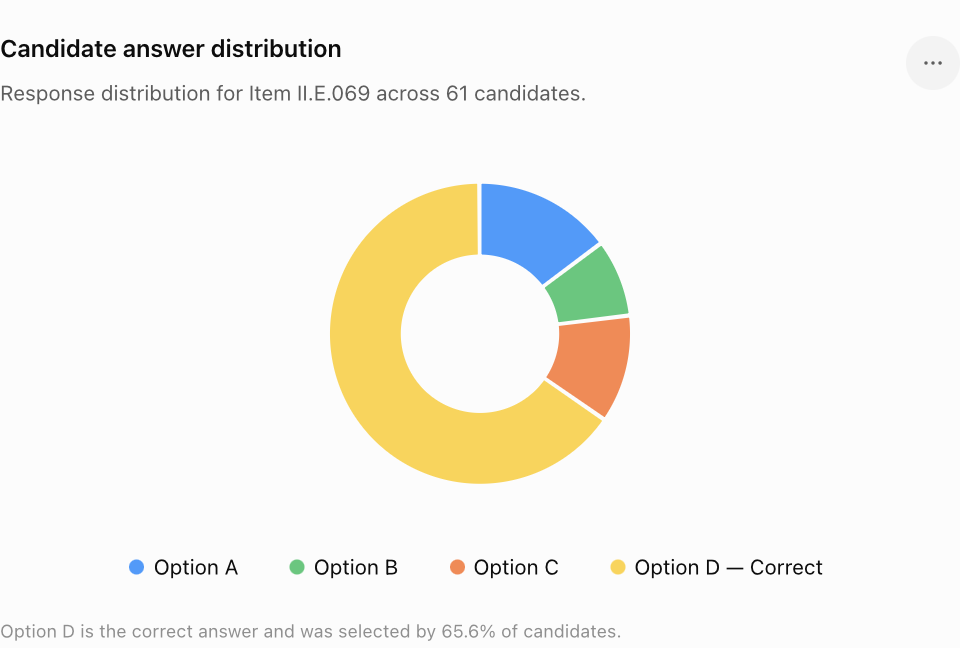
Multiple ChoiceResponse distribution across 61 candidates.
What We Analyse
Using candidate-response data, statistical analysis and expert item review, we evaluate the quality, reliability, validity and fairness of every assessment.
Identify questions that are too easy, too difficult, confusing or poorly discriminating, and determine whether each item is performing as intended.
Analyse how candidates interact with incorrect options to identify effective, weak, non-functioning or potentially misleading distractors.
Evaluate whether each question accurately measures the intended domain, competency, skill level and assessment objective.
Review questions for ambiguity, language quality, technical accuracy, cognitive level, answer-key integrity and option quality.
Evaluate score distributions, item-total relationships, internal consistency, Cronbach's Alpha and Standard Error of Measurement to determine the reliability of assessment results.
Assess whether passing standards are fair and defensible, using recognised approaches such as Angoff and decision-consistency analysis.
Identify unusual response patterns and potential indicators of Differential Item Functioning (DIF), bias or unfair item behaviour.
Monitor whether item statistics change over time and help ensure that scores remain comparable across different test forms and administrations.
For deeper assessment programmes, we support Item Response Theory (IRT), item fit, candidate ability analysis, DIF, test equating and item-parameter drift.
From Response Data to Actionable Insight
Item Difficulty
0.656Moderate
Total Rpbis
0.323Good Discrimination
Domain Rpbis
0.482Strong Domain Alignment
Candidates
61Responses analysed
Correct Answer
D40 candidates · 65.6%
Distractors
3 / 3All functioning
Psychometric Insight
Recommended Action: RetainThe item demonstrates an appropriate difficulty level and good discrimination, with stronger alignment to its intended domain. All three distractors attracted responses, indicating that they are functioning rather than being obviously incorrect.
Every Item Gets a Clear Decision
Our reporting transforms complex assessment statistics into practical answers:
The Outcome
We combine psychometric statistics, candidate-response behaviour and expert question review to help organisations build assessments that are relevant, reliable, fair and defensible.